Now that Column Formatting has begun rolling out to SharePoint Online tenants, I decided to look at some older use cases and test how they could be achieved with this new functionality.
The first use case is a common one: an item’s progress is tracked in a list with a percentage indicator – a project’s total completion so far, an individual task’s progress, etc. This is usually stored as a number and shown in percent:
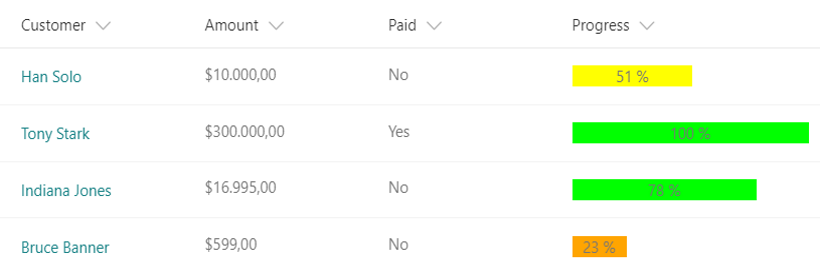
The goal now is to add a visual indicator, a coloured progress bar that makes it more appealing to look at the available data. The SharePoint team has already released an example of how something similar could be achieved, but without any additional colours:
Here’s what I created (code below), to test the formatting of the bar with different colours, as well as different other CSS styles (text alignment).
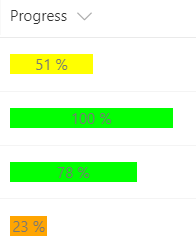
In this example, if the value is 33 or below, the background of the bar is orange. From 34 to 66 it’s yellow, and for anything above 66 it is green. I’m also using a narrow height for the bar instead of the full width by adding a <span> child element instead of putting my formatted content directly into the root <div>
And without further ado, here is the sample code I used:
{
   "elmType":"div",
   "children":[
      {
         "elmType":"span",
         "txtContent":{
            "operator":"+",
            "operands":[
               {
                  "operator":"*",
                  "operands":[
                     "@currentField",
                     100
                  ]
               },
               " %"
            ]
         },
         "style":{
            "background-color":{
               "operator":"?",
               "operands":[
                  {
                     "operator":"<=",
                     "operands":[
                        "@currentField",
                        0.33
                     ]
                  },
                  "#ffa500",
                  {
                     "operator":"?",
                     "operands":[
                        {
                           "operator":"<=",
                           "operands":[
                              "@currentField",
                              0.66
                           ]
                        },
                        "#ffff00",
                        "#00ff00"
                     ]
                  }
               ]
            },
            "width":{
               "operator":"+",
               "operands":[
                  {
                     "operator":"*",
                     "operands":[
                        "@currentField",
                        100
                     ]
                  },
                  "%"
               ]
            },
            "text-align":"center",
            "white-space": "nowrap"
         }
      }
   ]
}
Progress Bars with SharePoint Online Column Formatting https://t.co/o6Fo4m2uK3 #sharepoint #office 365 #columnformatting
Hi Rene,
This is a nice tutorial.
It works for most.
But only for some values which are under 20% it shows decimal. I am not sure if you see the same as well.
Like : 14.0000000000002% or 7.0000000002%
good data : 21%
Regards
Sowel
Thanks you.
https://t.co/EjlO0B3hRG
Progress Bars with SharePoint Online Column Formatting https://t.co/MxGxgNTpn8
RT @sympmarc: Progress Bars with @SharePoint Online Column Formatting by @modery https://t.co/k2U6EE9pUF -> Useful new sample. https://t.co…
RT @sympmarc: Progress Bars with @SharePoint Online Column Formatting by @modery https://t.co/k2U6EE9pUF -> Useful new sample. https://t.co…
RT @sympmarc: Progress Bars with @SharePoint Online Column Formatting by @modery https://t.co/k2U6EE9pUF -> Useful new sample. https://t.co…
RT @sympmarc: Progress Bars with @SharePoint Online Column Formatting by @modery https://t.co/k2U6EE9pUF -> Useful new sample. https://t.co…
RT @sympmarc: Progress Bars with @SharePoint Online Column Formatting by @modery https://t.co/k2U6EE9pUF -> Useful new sample. https://t.co…
RT @sympmarc: Progress Bars with @SharePoint Online Column Formatting by @modery https://t.co/k2U6EE9pUF -> Useful new sample. https://t.co…
RT @sympmarc: Progress Bars with @SharePoint Online Column Formatting by @modery https://t.co/k2U6EE9pUF -> Useful new sample. https://t.co…
RT @sympmarc: Progress Bars with @SharePoint Online Column Formatting by @modery https://t.co/k2U6EE9pUF -> Useful new sample. https://t.co…
RT @sympmarc: Progress Bars with @SharePoint Online Column Formatting by @modery https://t.co/k2U6EE9pUF -> Useful new sample. https://t.co…
RT @sympmarc: Progress Bars with @SharePoint Online Column Formatting by @modery https://t.co/k2U6EE9pUF -> Useful new sample. https://t.co…
RT @sympmarc: Progress Bars with @SharePoint Online Column Formatting by @modery https://t.co/k2U6EE9pUF -> Useful new sample. https://t.co…
Progress Bars with SharePoint Online Column Formatting – Rene Modery https://t.co/BqJbYrIKCD via @modery https://t.co/ABS4Nj9D1I
RT @KbWorks: Progress Bars with SharePoint Online Column Formatting – Rene Modery https://t.co/BqJbYrIKCD via @modery https://t.co/ABS4Nj9D…
Thank you for your article. It is very informative. I have an interesting question for your format.
Progress is usually associated with completion (blue). What would it take to have the progress % be blue, and the background color of the bar (= 100%), associated from a separate column?
Your “status” (Red, Yellow, Green) could be different for various reasons not associated with the progress. So, if your progress is 50%, 1/2 the bar would be blue. If your “status” column (choice) is Red, the second 50% of the bar would be Red. Go to status column, change to yellow, then second 50% would be Yellow, and progress 50% is still blue.
Hi Rick, added a new post which addresses this functionality: https://modery.net/progress-bars-with-sharepoint-online-column-formatting-april-2018-update/
Dumb question, but where do you put the code? I’m using SharePoint 2016.
Hi Gretchen, this is only available in SharePoint Online (Office 365), but not in SharePoint 2016
Hello Can you add a step by step process to add the code ? where do we add it ,? do we need a webpart ? etc etc pleaaaaase !
JSON no longer appears to be working on SharePoint online.
Can you please review and update?
Hi Pete, still working on my end, and haven’t seen any communications that JSON wouldn’t be supported anymore (see e.g. https://docs.microsoft.com/en-us/sharepoint/dev/declarative-customization/column-formatting, which still describes how to use JSON).
Can you explain why it seems to no longer work for you?
Hi, When I paste the code the column values no longer show in the Sharepoint list for the column I am trying to format, I’ve tried a few different column configurations incase it was that but to no avail, what is your column configuration for the field you have applied the code against?
When I pasted the code from the MS repos for the progress bar this worked as expected, but of course I am after after the dynamic colours when a particular threshold has been reached.
Hi Pete, found the issue. Code sample above used “< ;=” twice, but should’ve said “<=". I just fixed it.
Hi. This is really useful. I want to create a progress bar similar to yours but when progress is 30% then 30% of the bar will be filled with green colour and rest 70% will be filled with red color
Similarly if progress bar is 40% then 40% should be green and 60% should be red.
Could you please give a code for that? I have searched everywhere it’s either through power automate or through webpart, there’s nothing related to column formatting
Could you please
This is not perfect (text doesn’t show properly for low percentages), but it shows the green/red correctly. Use a parent div and add 2 child spans inside. First span uses the percentage width with a green background, second span uses (1- percentage width) with a red background:
{"$schema": "https://developer.microsoft.com/json-schemas/sp/column-formatting.schema.json",
"elmType": "div",
"children": [{
"elmType": "span",
"children": [
{
"elmType": "span",
"txtContent": "=(100 * @currentField) + ' %'",
"style": {
"padding-left": "8px",
"white-space": "nowrap"
}
}
],
"style": {
"padding": "0",
"width": "=if(@currentField > 1, '100%', if(@currentField < 0, '0', (100 * @currentField) + '%'))", "box-sizing": "border-box", "background-color":"lightgreen" } }, { "elmType": "span", "children": [ { "elmType": "span", "txtContent": "", "style": { "padding-left": "8px", "white-space": "nowrap" } } ], "style": { "padding": "0", "width": "=if(@currentField > 1, '0%', if(@currentField < 0, '100', (100-(100 * @currentField)) + '%'))", "box-sizing": "border-box", "background-color":"red" } } ] }
Great tuning, but when I used it , the numbers are changing to be with fractions “Such as 14.000000000002%”
how can I make sure it is without decimals ??
Great stuff! Still works great! Super late here but could you provide the exact same code but intead of thin bars (and small font), they are regular size with regular size font?